EBooks and Future of the US Book Publishing Industry (Part-I)

Part-I on this series will analyze the current state of the US book publishing industry -the key players, the value chain and profit distribution between the various players and rules that define competition within this industry.

Part-II will address the key challenges and strategic choices confronting both established and new entrants as EBook adoption accelerates. Will the EBook value chain differ significantly, how will incumbents react and who will come to dominate the landscape. Will EBooks lead to a new winner like Apple in digital music. If not why not.

US Book Publishing Industry Dynamics:

Book Publishing is essentially a “Hit-or-Miss” game of chance.Much like the movie and music industry the following rules apply:

  1. Sunk Cost Rule – All of the cost of putting together and publishing a book is fixed and up-front. Irrespective of how the book is received the costs cannot be recovered.

  2. Hit-Books Rule – There is no proven formula that will guarantee that a book will be a runaway success before its publication. Sales from a few “Hit Books” cover up for lost revenues from other not so successful books. The ratio of “Hit-Books” to “Failures” varies between 3% to 8%.

  3. Franchise and Brand Name Rule – A few well known authors enjoy cult like following based on their previous works or series of books. The lure of astronomical sales leads to a frenzy among publishers to find and sign up big name authors. 

  4. Deep Pockets Rule – Only those publishers who can sustain multiple failures for the chance of few elusive hit stand to survive. The result consolidation, enormous bargaining power and leverage enjoyed by book publishers.

  5. Retail Network Rule – Selling books requires a deep network of established relationships with book sellers and big retailers. Retail shelf space is highly contested for. Retailers have gained enormous clout from consolidation in the recent years.

  6. Book Returns Rule – The practice of allowing book sellers to return unsold inventory first instituted during the Great Depression continues till today. Book returns run as high as 20% for publishers.

Stakeholders in the US Book publishing industry:

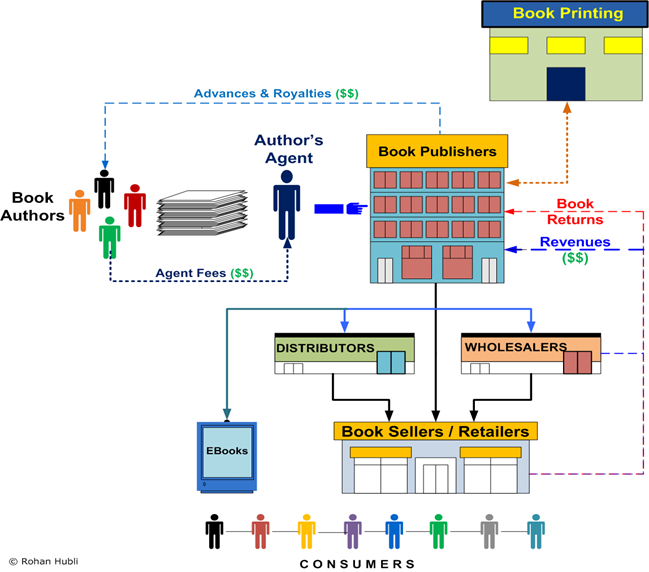
  1. Book Publishers
  2. Book Authors and Book Agents
  3. Book Sellers, Retailers and Distributors
  4. Buyers( Consumers, Institutional Buyers and Libraries )
  5. Service Providers ( Printing, Marketing, Logistics )
The US Book Publishing Industry – Value Chain

Across the value chain, US Book Publishers and Retailers enjoy significant clout and power base when it comes to negotiating prices, striking deals, managing access to resources, cultivating readers and promoting self interest. 

BookPublishingIndustry

Distribution of Profits across the US Value Chain:

The distribution and allocation of profits (Print Books) across the US Book industry is skewed in favor of those intermediaries that can offer customer something they value, influence sales and offer value added services.

Pre-Production costs include the costs of writing, editing and reviewing manuscripts. The printing costs include the cost of physical paper, artwork and binding the book. This cost varies depending on the book size, number of pages, and illustrations used.

The publisher’s overhead includes the cost of maintaining a staff of editors, proofreaders, book designers, publicists, sales representatives and so on.

Marketing and promoting the book is another expense that include printing catalogs, media and print campaigns, sending out review copies to critics, arranging a promotion tour with the author and trade promotions for retailers all add up the cost of bringing a book to the market. 

For retailers there is additional cost of operating and staffing the store, allocating shelf space, stocking the book, maintaining inventory and servicing customers. To a certain extent they can exploit economies of scope in buying and selling books.

ProfitDistribution-HardCoverBook

* Assumes a hardcover book with a retail selling price of $29.95

The two powerful groups- “Book Publishers and Book Retailers” who stand to lose the most, with any disruption in the status quo, will explore all possible avenues to retain control over the emerging EBook ecosystem.

US Book Sales Market Size:

Forrester Research puts the overall size of the US book market at around $25 Billion. Books Sales between 2002 and 2008 have varied from a low of $22 Billion to a high of $24 Billions at a compounded annual growth rate of around 1.6% in the same period.

Over time a good chunk of that is going to migrate towards EBooks. 

Total book sales fell 2.8% in 2008, to $24.2 billion, according to preliminary estimates released by the Association of American Publishers.

AnnualUSBookSales-2008

The top categories which dominate book sales today are:

  1. Adults and Children’s Books (33%)
  2. Elhi-Elementary, High School Books (25%)
  3. Professional Books (14.25%)
  4. Higher Education – Post Secondary (15.57%)

The question confronting Book Publishers- Which category renders itself the most vulnerable from the threat imposed by EBooks.

Book Buyers: Who are they ?

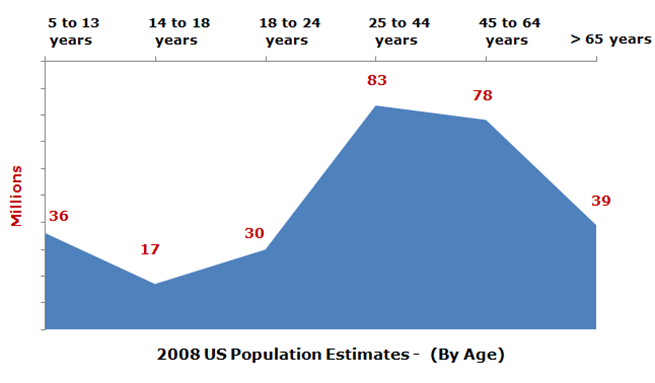
According to BISG, people above the age of 50 buy more than half of all books. The older demographics of devote book readers have disposable incomes and time to read (stable customer base).

The demographic breakdown of book buyers based on 2008 population estimates puts the total market size in this segment to around 110 Million. As a customer base this segment is very important and cannot be ignored.

USPopulationEstimates 

The other major group comprises of school and college students: children, teens and younger adults. As a customer base they have the shortest lifespan correlating with the stage in their lifecycle. A few perhaps could evolve as avid readers later in their adult life.

Year

Elhi Enrollment
   %    Growth

Postsecondary Enrollment

% Growth

2008

55,879,000

N/A

18,200,000

N/A

2009

56,116,000

0.42%

18,416,000

1.19%

2010

56,400,000

0.51%

18,613,000

1.07%

2011

56,781,000

0.68%

18,822,000

1.12%

 
In 2008 revenues from book sales to Elhi and Postsecondary college students amounted to around $9.8 Billion. On an average a college students spends close to $1000 per year on textbooks. 

The challenge than for Book Publishers grappling with strategic initiatives on how to face the threat imposed by EBook adoption and penetration boils down to the following: 

You have two important customer segments:
  1. People above the age of 50, your most valuable customer base is not going to change their years of reading habits. A few perhaps YES but the vast majority will continue to consume books the old fashioned way – print bound. How to position EBooks within this segment.

  2. School and College Students, you can change and influence their book reading behavior during the formative years. The question arises who will invest and how much to promote EBooks in a big way.  Access to this segment is controlled via powerful decision makers – departments heads of schools, colleges and universities, state and federal education boards.

References:

  1. Association of American Publishers
  2. National Association of College Stores
  3. US Census Data
  4. Book Publishers websites and SEC filings.
  5. PWC: Global Entertainment and Media Outlook: 2008–2012

Facebook, $1 Billion Company ?

Advertisers annually spend about $265 billion across 11 different types of media to reach U.S. consumers.

Facebook, has established itself as a social networking site to reckon with and potentially see revenues of $1 Billion by 2015. The audacious goal seems very much possible in light of the following trends:

  1. Contraction in offline Ad spending as advertisers migrates to less expensive media with better ROI potential. Online advertisement is the best obvious choice.
  2. The advent of DVR has deprived television advertisers of a valuable stream to reach a large user base.
  3. Declining Newspaper subscriptions (7%) will force advertisers to reallocate their budgets and find new means to deliver national and local advertisements. Historically newspapers have accounted for a 2.5 x multiple for each AD impression served per household.
  4. Paid Search Advertisements while very effective for National Brand advertisers has failed to generate the same kind of impact for local and small businesses.

Social Networking sites come closest to replicating the 2.5 x multiple for each AD impression served because a typical user is connected to 100’s of other users, friends and family. Facebook definitely has the potential to address all or some of the above challenges and offers advertisers a unique value proposition.

Revenue projections assuming a modest 5% market share for Facebook, of the overall graphical advertising market, put revenues from advertising alone to about $800 Million by 2015.

Local Online Advertisements

2010

2011

2012

2013

2014

Annual Local Online Ad Impressions Served (Billions)2

296

342

342

342

342

Facebook: Share of Local Online Ad Impressions

2.00%

2.64%

3.48%

4.60%

5.52%

Facebook Local AD Impression Multiple

3

3

3

3

3

Cost per thousand impressions (CPM)

$7.50

$7.43

$7.35

$7.28

$7 click here now.20

Annual Local AD Revenues

$133,105,500

$200,903,319

$262,540,457

$343,087,869

$407,588,389

National Online Annual Advertisements

2010

2011

2012

2013

2014

National Online Ad Impressions Served (Billions)1

2,689

2,823

2,823

2,823

2,823

Facebook: Share of Online Ad Impressions

2.00%

2.60%

3.12%

3.74%

4.49%

Facebook AD Impression Multiple

2

2

2

2

2

Cost per thousand impressions (CPM)

$1.15

$1.13

$1.12

$1.10

$1.08

Annual National AD Revenues

$123,694,000

$166,309,675

$196,578,036

$232,355,239

$274,643,892

Total Annual AD Revenues

$256,799,500

$367,212,994

$459,118,493

$575,443,108

$682,232,281

References:

  1. J.P Morgan Global Equity Research, Jan 2009
  2. Economics of Search Marketing, Borrell Associates, June 2009
  3. IAB Internet Advertising Revenue Report, 2008

Buyers & Purchase Motivation

Summary on the five different purchase motivations encountered by shoppers:

  1. An economic motivation, where the main goal is to save money; ( Bargain Hunters, Ex: Coupon Shoppers )
  2. A hedonistic motivation, where the aim is to feel pleasure; ( Pleasure Seekers, Ex: Mall Shoppers )
  3. A routine-loyal, or risk-avoiding, one, where the goal is to reduce the risk of being disappointed by a purchase by remaining loyal to a favorite brand or store; ( Risk Averse, Ex: Changing toothpaste)
  4. A relational one, where buyers seek to establish a relationship with a store or its staff and be recognized as a privileged client; ( Social Class, Ex: iPhone buyers )
  5. A functional one, where the aim is to decrease the time and effort devoted to making purchases. (Search Costs, Ex: High Income / Senior Grocery Shoppers)

The challenge then becomes how to identify your buyers and classify them into one of the above categories. Some of the approaches involve:

  • Club Card membership to observe and monitor purchase behavior.
  • Cookies that track user browsing behavior
  • Utilizing clues from consumer’s behavior to build a psycho-graphic profile.
  • Direct Email Campaigns that tout coupons.
  • Analyzing buyer traits based on life-cycle stage. i.e. Younger Adults prefer brand name fashion designers
  • Social Networking sites such as Facebook can be a valuable tool in uncovering buyer traits.

References:

  1. MIT Sloan Review: Rewards that Reward
  2. Consumer Behavior: A Strategic Approach, Henry Assael

Vizio LCD-TV : North American Retail Channel Strategy

When Digital-TV entered mainstream North American market the price point for a 40-in plasma and LCD-TV system averaged around $2000 – $2500 (2003/2004). With an average CRT TV selling well under $500 the market for HDTV was limited to early adopters and lead users with significant disposable incomes.

Given the dynamics in consumer behavior Vizio’s target market segment for its initial launch was limited to the 35+ age group, who are affluent, college educated with significant disposable income. LCD TV’s sold by Vizio weren’t particularly known for superior image quality or build quality, but rather for affordability and value for the money.

The target market segment for its initial launch was limited to the 35+ age group, who are affluent, college educated with significant disposable income. LCD TV’s sold by weren’t particularly known for superior image quality or build quality, but rather for affordability and value for the money.

How could a relatively new entrant such as Vizio establish a presence and reach its intended target customer base?

This analysis looks at why Vizio, the LCD-TV maker choose Costco as their retail channel of choice at entry. What were the strategic and competitive implications and the overall dynamics within the industry that a relatively new entrant such as Vizio faced when entering the highly competitive LCD TV market dominated by big global players. How did Vizio use their success from the warehouse club retail channel to finally gain entry into mass-market retailers?

Incumbents and Barriers to Market Entry

The market for consumer electronics and television systems has traditionally been dominated by well established players such as Sony, Panasonic, Philips, Toshiba, Samsung and LG among others. A comparative analysis on their strengths is captured in detail below.

Competitive Leverage

Vizio

Sony

Samsung

Sharp

Access to Retail Channels

Low

Established Relationship

Established Relationship

Established Relationship

Supplier Strength & Relationship

Dependent on outside suppliers for LCD panel.

May find itself at the mercy of component suppliers during high demand.

Relies extensively on Contract Manufactures

Manufactures Panels.

Can leverage it position in market to squeeze component suppliers.

Combination of Contract Manufactures and In-House Production.

Manufactures Panels

Can leverage it position in market to squeeze component suppliers.

Combination of Contract Manufactures and In-House Production.

Manufacturers Panels

Can leverage it position in market to squeeze component suppliers.

Combination of Contract Manufactures and In-House Production

Access to Technology

( Software, Hardware, & Manufacturers )

Follow industry Leaders.

In a position to dictate and control technology development and licensing.

Can dictate and control technology development and licensing.

Follow Industry Leaders

Economies of Scale

Limited in its ability to realize economies of scale.

Economies of scale dependent on LCD units/ panels shipped because of HIGH CAPEX expenditures associated with FABS.

Economies of scale dependent on LCD units/ panels shipped because of HIGH CAPEX expenditures associated with FABS

Economies of scale dependent on LCD units/ panels shipped because of HIGH CAPEX expenditures associated with FABS

Economies of Scope

Relatively unknown brand with limited product offering.

Brand name can be leveraged to realize economies of scope in marketing and product adoption.

Brand name can be leveraged to realize economies of scope in marketing and product adoption.

Brand name can be leveraged to realize economies of scope in marketing and product adoption.

Pricing

Has to undercut competitors to gain market share.

Well known brand can command a Very HIGH premium

Well known brand can command a HIGH premium

Well known brand can command a premium

Being a new and unknown entrant in a highly competitive market was one of the biggest challenges for VIZIO. To get an edge in the market VIZIO would need to differentiate based on price. In order to gain access to the customers using well established retail channels Vizio would have to strike retailer partnerships and provide better incentives than incumbent’s margins, sales commission and marketing promotions.

Being a new and unknown entrant in a highly competitive market was one of the biggest challenges for VIZIO. To get an edge in the market VIZIO would need to differentiate based on price. In order to gain access to the customers using well established retail channels would have to strike retailer partnerships and provide better incentives than incumbent’s margins, sales commission and marketing promotions.

Consumer Segmentation

The ideal customer segment that VIZIO went after was “Imitators” a self-informed segment with awareness about LCD-TV product and the technology. By going after “Imitators”, VIZIO won’t have to incur the costs of promoting the product to the innovator segment and ride on the marketing awareness generated by established incumbents.

North American Retail Channels and Power
The retail channel in North America is dominated by four major categories of retailers each with significant clout, market reach and market share:

  1. Big-Box Retailers : Wal-Mart, Target, Sears and the likes
  2. Specialty Electronics Retailers: Best Buy, Circuit-City, RadioShack and the likes
  3. Warehouse Club Retailers: Costco, Sam’s Club, BJ’s and others
  4. E-Retailers: Amazon, Crutchfield and Dell among others

Online retailers were not really an option for Vizio since the average consumer spent less than $300 on a consumer electronics purchase.

Visio-RetailChannel

Retail Channel Costs and Margins

The various retail channels pose different challenges, margins and capability for Vizio in reaching its prospective end customer. Table below summarizes the key challenges with various retail channels.

Channel Characteristics

Warehouse Club Retailers

Traditional Retailers

Specialty Electronic Retailers

Marketing & Promotion Costs for Manufacturer

Lowest

High

Highest

Sales Commission

None

Low – Medium

Medium – High

Revenue / Profits Streams

Mark Ups

Markups, Volume Discount, Double Marginalization, Sales Promotions

Markups, Volume Discount, Double Marginalization, Sales Promotions

Influencing Buyer Purchase Decision

Neutral

Manufacturer Incentives and Commissions

Manufacturer Incentives and Commissions

Profit Margins

10 – 15%

20 – 30%

25 – 40%

Distribution & Logistics

Managed by Retailer or 3rd Party Distributor

3rd Party Distributor

3rd Party Distributor

Table 1: USA Retail Channel Characteristics and Costs

Warehouse VS. Retailer Margins

Keeping prices low was one of the key differentiating and positioning factors for VIZIO. Catering to high-end retailers meant that there could be additional marginal costs added by the retailer, which would hike up the price. The warehouse clubs do not double marginalize the products they sell since 70% of the revenues come from membership fees. By selling products only at warehouse club retailers, Vizio would avoid double marginalization and ensure a lower retail price for the consumer.

Warehouse Club Retailers and Market Reach

Some of the major players in the Warehouse Club Retailer space were BJ’s warehouse, Sam’s Club and Costco. The average stock keeping unit for each of these warehouses and the number of stores nationwide is shown below. Given the reach of this warehouse retail network to the consumer public, and its low margin cost model, VIZIO used these outlets as the channel for its products.

WarehouseClubRetailers-Stats
The three major warehouse club retailers are located throughout the USA, and offer full geographical coverage across the country. Therefore, their reach to the broad consumer base is not diminished. The break-up of VIZIO’s average sales percentage at each of these warehouse stores is shown in the chart above. As we can see, a large percentage of the sales will occur at Costco.

Analyzing Competition at Traditional Retail Channels using Game Theory

An intuition for incumbent reaction across traditional and specialty electronic retail channels can be built using the Game Theory. Based on anticipated response the incumbents will fight aggressively against Vizio’s entry. A protracted pricing war would seriously undermine Vizio given its limited financial resources to fight incumbent promotions, volumes discounts and sales commissions.

Unit Sales (Traditional Retailers) (Payoff is # Units Sold)

Sony / Samsung / Philips / LG

Fight

Accommodate

Vizio

Fight

30%, 70% (M+)

40%, 60% (M)

Accommodate

20%, 80% (M)

25%, 75% (M)

If both incumbents and Vizio “Fight” there will be price erosion leading to an increased market size M+ (# units sold). All participants will benefit with established players such as Sony, Samsung and Philips gaining more than Vizio on account of their brand image and prevalence in the consumer electronics market.

If the incumbents and Vizio both accommodate, then there is no price erosion and market is expected to be M (# units sold).The market (M) will probably be split among all players and whoever accommodates is to expected loose share of market share to the other.

Analyzing Competition at Warehouse Club Retailers using Game Theory

An intuition for incumbent reaction across warehouse club retail channels can be analyzed using the Game Theory. Based on the anticipated response, the incumbents will ‘Accommodate’ & Vizio will ‘Fight’

One reason for this behavior is that the Federal Robinson-Patman Act that prohibits manufacturers and suppliers from providing price discounts and other forms of preferential treatment to some buyers and not to others. Existing contracts with traditional retailers will prohibit incumbents from matching Vizio’s low prices and margins offered to warehouse club retailers such as Costco.

Unit Sales (Warehouse Club Retailers)(Payoff is # Units Sold)

Sony / Samsung / Philips / LG

Fight

Accommodate

Vizio

Fight

30%, 70% (M+)

40%, 60% (M)

Accommodate

20%, 80% (M)

25%, 75% (M)

Vizio – Costco Retail Partnership: A Win-Win

Vizio’s strategy to enter the retail channel with Costco to launch its range of LCD-TV’s was the right choice given the enormous power that USA retailers enjoy. The low-price strategy and lack of brand name were factors that played in favor of Costco.

At Costco, Vizio relied extensively on prospective buyers to pick its LCD-TV’s without any assistance from retail floor personnel in influencing and steering the customers during the sales process. The strategy made sense given Vizio low brand awareness. At traditional retailers Vizio would stand no chance competing against big brand names with marketing muscle and promotions aimed at influencing consumer buying process.

A typical USA Warehouse Club Shoppers shares the following traits:

  • 35+ yrs,
  • Affluent, with disposable income

Costco also requires that a manufacturer sell directly to them. This works in favor of Vizio and eliminates costs and markups associated with middle distributors.

Costco’s no frills based selling with minimal marketing and advertisement expenditures is synergistic with Vizio’s low cost approach to selling. Vizio as a new entrant does not have the advertisement and marketing budgets to take on established stalwarts such as Sony, Samsung, Sharp and others.

Given Vizio’s limited financial resources and low brand awareness, Costco was the ideal choice to enter the highly competitive LCD TV market for the following reasons:

  1. Costco’s profits margins and hence markup on products sold at its retail locations average between 10-15% compared to other retail channels. Allows Vizio to sell products at a lower cost its key differentiator against major brand names.
  2. Eliminates additional cost associated with maintaining a 3rd party distributor as Costco manages all its inventory and logistics in-house. Avoids channel conflicts associated with double marginalization as Costco negotiates a standard markup irrespective of the number of units sold or incentives offered.
  3. Vizio does not need to spend marketing dollars on sales commission or to run major promotions and advertisement campaigns. Costco runs a lean-mean marketing campaign with limited promotions advertised only to members.

Vizio success can be attributed to its unique channel strategy. Its warehouse club channel focus and lack of channel conflicts enabled the company to achieve disruptive price points-helping to fuel the rapid rise of the warehouse club channel in the US TV market and causing its shipments to surge.

Expanding Retail presence

Finally, VIZIO management knew that they did need to make a concerted effort to move outside the warehouse club channel and did so successfully at Circuit City, Sears and Wal-Mart. The early success with Costco and Sam’s club that enabled Vizio to reach #3 ranking by 2006 allowed it to negotiate better terms and gains additional retail presence.

Vizio was able to maintain the Club channel price points in most cases and benefited nicely from Circuit City and Wal-Mart ramping in Q2 2007, which resulted in significant growth and the #1 ranking in the North American flat panel TV market.

Visio-RetailShelfSpacel

Acknowledgments:

This analysis would not have been completed without the helpful and critical inputs provided by Archana Arunkumar, Anoop Ramgiri and Venkata Duvvuri. The informal discussions with Costco retail store employees have also contributed immensely in understanding the business of warehouse club retailers.

References:

  1. DisplaySearch LCD-TV Market Research data
  2. Samsung LCD-TV projections 2005 – 2011
  3. US Census Bureau Annual Benchmark Report for Retail Trade, 2006
  4. NPD Group
  5. ABI Shopper Poll, Nov 2005
  6. Costco : Telsey Advisory Group Report
  7. Vizio Company Press Releases.

Brocade & Foundry Networks: Behind the merger

The world is converging to Ethernet and IP. What happened to Telecom is now happening in the Data Center. Parallel infrastructures are costly to support, implement, operate, and maintain. Why have separate infrastructures for Storage (Fibre Channel) when you have an existing Ethernet infrastructure completely capable of supporting Storage networking?

Before Convergence                                                          After Convergence

 ConvergedDataCenter

While Cisco already has a Fibre Channel over Ethernet (FCoE) switch shipping today, the Cisco Nexus 5000, Brocade has nothing to offer and needs to play catch up. It takes tremendous amount of investment and R&D to bring an FCoE capable switch to the market.

The FCoE market opportunities for Brocade will be large and of high strategic importance. Early dominance of market share could expand to a long-term leadership position in the evolving SAN market.  This is possible because FCoE is clearly a disruptive technology, one that could change the underlying SAN infrastructure, business models, and, as a consequence, major players servicing and driving the industry.

Synergies:

Brocade is the leader in data storage networking in data centers with significant technology, product, distribution and installed base advantages.  Foundry is the leading innovator in data networking for enterprises and service providers, including performance leadership in the emerging 10GigE market.  With Brocade’s strengths in Fibre Channel technology and data storage and Foundry’s strengths in networking and Ethernet technology, Foundry is complementary to Brocade, not redundant. 

By combining, they will be a bigger, stronger company with additional diversification, technical IP, increased R&D and economies of scale.  They will be able to provide leadership across the breadth of the networking industry and their combined strengths will play to where the market is heading – highest performance and reliability, new and converged technologies.

Brocade and Foundry Networks: Product Synergies

The Brocade, Foundry Networks merger will allow the two companies to develop a Data Center switch capable of meeting the needs of a converged network and tackling Cisco’s emerging threat in the data center space.

Product Synergies

Table 1: Brocade and Foundry Networks Product Synergies

Brocade’s storage area network expertise can be leveraged against Ethernet based networking expertise from Foundry Networks to develop the next generation Data Center switch capable of competing against Cisco Systems.

Brocade and Foundry Networks: Channel Synergies

Brocade has fared quite well internationally while Foundry’s success has come from domestic sales, such as those to the federal government. Brocade has relied mainly on OEMs to move its gear while Foundry’s focus has been on direct sales and channel partners. From the marriage then comes a more rounded supplier.

Brocade and Foundry Networks: Cost Synergies

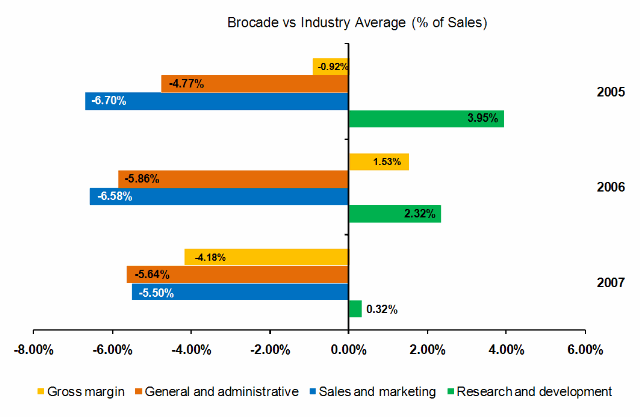
Brocade’s investment in R&D as percentage of sales has been declining year over year although its spending is still higher than the industry averages.  At the same time Brocade has seen rather steep erosion on its gross margins as a percentage of sales. Brocade will face challenges going forward as reduced R&D spending and declines in gross margins will seriously undermine its position to meet growth with its current portfolio of products. 

BrocadevsIndustryAverage

Figure 1: Brocade Spending vs. Industry Averages (% of Sales)

Foundry Networks enjoys a healthy gross margin on its sales, better than the industry average. The gross margins have remained steady and improving, a significant indication of Foundry’s successful product line. The high sales and marketing costs are an area that can be optimized.

FoundryNetworksvsIndustryAverage

Figure 2: Foundry Networks Spending vs. Industry Averages (% of Sales)

Brocade/Foundry Combined Strengths:

A merger between Foundry Networks and Brocade will allow both companies to realize economics of scale in Sales and Marketing costs. The combined entity will further boost Brocade’s revenues by offering end-to-end data networking and storage solutions.

Brocade’s storage area network expertise can be leveraged against Ethernet based networking expertise from Foundry Networks to develop the next generation Data Center switch capable of competing against Cisco Systems.

BrocadeandFoudry-CombinedStrength

Table 2: Brocade & Foundry Combined Strengths

References:
  1. Brocade 10-K SEC Filings for 2005-2007 
  2. Foundry Networks 10-K SEC Filings for 2005-2007
  3. 10-K SEC Filings 2005-2007 Major Players in the Networking Industry

Cisco Systems : An analysis on Organizational Structure for Competitive Advantage

Cisco Systems a company that has reinvented itself time and again has proved that the key to corporate success lies in an organizational structure that is both responsive and in tune with the changing industry and market requirements browse this site.

Phase-1: The Emergence of a Giant

In April-1997 Cisco structured its products and solutions into three customer segments: Enterprise, Small/Medium business, and Service Provider. The organizational structure was crafted to address two major new market opportunities at that time: the service provider migration to IP services and the adoption of IP products by small and medium-sized businesses through channel distribution. The change was a marked departure from a product-focused structure, which had been Cisco’s hallmark since inception back in1987, to a customer-oriented, solutions-based structure.

CISCOSystems-OrganizationStructure-1

All of Cisco’s research-and-development and solutions marketing would be organized under the three Lines of Business. The Line of Business teams defined and implemented both market and operational strategies that enabled them to deliver end-to-end solutions to their target customers. The new organizational alignment meant increased focus on specific customer segments to provide complete end-to-end solutions, including integrated software, hardware and network management. The different market segments at the time had nothing in common. The fact that Cisco was riding high on the imploding growth in the networking industry meant Cisco did not have to worry so much on costs since margins very high.

An analysis on the effectiveness of “Product Based” organizational structure reveals the following attributes.

Product Centric Organization

Effectiveness

Knowledge Sharing

Low

Ability to reduce Costs

Low

Fostering Innovation

High

Control and Coordination

Medium

Addressing Customer / Market requirements

High

Efficiency in Resource Utilization

Low

Phase-2: The Dot-Com Meltdown

In August-2001, Cisco Systems realigned the company’s focus around changing industry and customer requirements and to reinforce the company as a dominant force in the networking industry. Customer segments and product requirements that were distinct in the past had become blurred. The downturn in the networking industry that followed the broad meltdown across the technology industry in early 2000 meant Cisco had to act quickly to minimize costs and reduce overhead. To respond to these changes Cisco zeroed in on a centralized engineering and functionally driven organizational structure.

CISCOSystems-OrganizationStructure-2

The centralized structure was developed to bring Cisco closer to its customers, to encourage teamwork and to eliminate product and resource overlaps and more importantly to provide the industry’s broadest family of products united under a consistent architecture designed to help Cisco’s customers improve productivity and profitability. The rationale behind a centralized organizational structure was to design all equipments using a baseline standard and architecture, which lowered the cost of product development and manufacture. A centralized organizational structure fostered deeper sharing of knowledge and components across Cisco product groups while promoting more consistent manufacturing and testing to realize economies of scale.

A centralized organization structure enabled Cisco to respond successfully to changing market conditions. The company’s focus was on reigning in costs and respond to revenue shortfalls from declining growth prospects within the industry. The emphasis shifted from delivering new product launches or innovation to survival. An analysis on the effectiveness of “Centralized” organizational structure reveals the following attributes.

Centralized Organization

Effectiveness

Knowledge Sharing

High

Ability to reduce Costs

High

Fostering Innovation

Low-Medium

Control and Coordination

High

Addressing Customer / Market requirements

Low

Efficiency in Resource Utilization

High

Phase-3: Convergence

In December-2007 Cisco announced a new “Technology Organization” structure to address the challenges imposed by the next phase of Internet growth and productivity centered on the demands of tremendous growth in video, the revolution in the data center, collaborative and networked Web 2.0 technologies, where the network emerged as a platform for all forms of communications and data management. The new organizational structure enabled Cisco to position itself for growth in new markets and cater to new and emerging markets in China, Brazil and India.

“The Technology Organization”:

CISCOSystems-OrganizationStructure-3

The changes were designed to enhance Cisco’s effectiveness and efficiency globally in delivering integrated products and solutions, as well as to provide greater synergies in its development process. The need for innovation and ability to cater to different market segments that had different product requirements necessitated a move toward a product-technology based organizational structure. With the industry evolving towards a services based Pay-As You Go” revenue model Cisco had to develop products with scalability, reliability and adaptability in mind. The emphasis on software and centralized nature of the Software Group allowed Cisco to access resources globally while driving integration and interoperability across all of Cisco product lines.

An analysis on the effectiveness of the “Technology Organization” structure reveals the following attributes.

Technology Centric Organization

Effectiveness

Knowledge Sharing (Across Divisions)

Medium

Ability to reduce Costs

Low

Fostering Innovation

High

Control and Coordination

Medium – High

Addressing Customer / Market requirements

High

Efficiency in Resource Utilization

Medium

References:

1. Cisco’s Technology Vision for the evolutions of Networking.
2. Cisco Systems Corporate Timeline

Ideal Product Features: Emotional or Rational ?

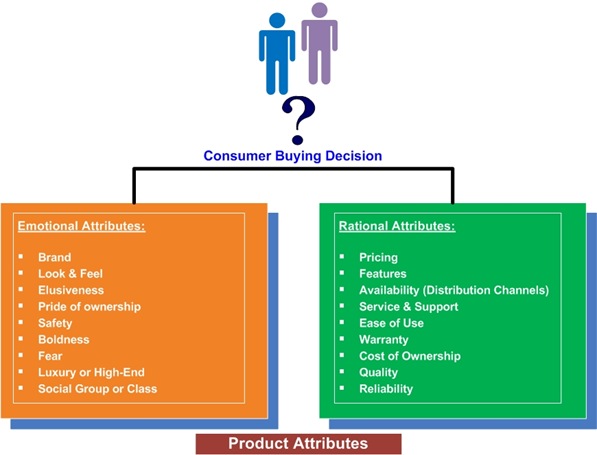
From my observations and analysis I have found that any decision by a buyer (consumer) to buy a product or service is based upon either of the two choices:

1. A Rational process of elimination:

Where in the buyer will compare products based on price, features, benefits…. and then make a decision on whether to buy the product or the service. Bottom line is it is harder to sell when there is intense competition as products have to meet or beat the nearest rival on a lot of fronts.

2. An Emotional appeal.

When a product or service strikes an emotional appeal with a buyer, be it because of the look & feel, appearance, brand name, or pride of ownership, the products are easy to sell . However it is also much more difficult to create an emotional connection with the buyer. Quite often products in this category sell even though they may lack the features or benefits that other rivals can offer.

ConsumerDecision-RationalvsEmotional-2

Applying this concept, we can evaluate various products available today in the marketplace in terms of their appeal (Rational or Emotional) to prospective buyers.

An example of an exercise with different products picked at will shows the following attributes as judged by me. The same may yield different results depending on the perceived benefits by others.

Product Attributes
(Emotional / Rational )
Volvo iPhone Tiffany’s Safeway Bread
Brand
Elusiveness × × ×
Safety × ×
Luxury / High End ×
Pride of Ownership ×
Social Group / Class
Pricing × × ×
Features × × ×
Availability
Service & Support ×
Ease of Use × × ×
Warranty × ×
Quality
Reliability × ×
Reputation
Cost of Ownership × ×

What then is an “IDEAL PRODUCT” that can appeal to both categories of buyers ?

An “IDEAL PRODUCT” has features that strike a balance by appealing to both the emotional and rational minded buyers.

IdealProduct

This may help explain why products such as an iPhone, or a BMW command such a premium and enjoy a loyal customer base even though the competition (Nokia N95, Audi/Lexus) can offer much more for the same or better price.

iPhone Launch: Navigating Powerful Intermediaries

In most consumer oriented markets powerful intermediaries such as retailers, distributors or powerful stakeholders yield significant clout in deciding what products or services reaches the end buyer/user.

In the cell phone market we have two important stakeholders whose participation is a must for any product to succeed – Cell-Phone Subscribers and Wireless Service Providers. Between the two Wireless service providers holds enormous leverage over handset manufacturers on account of their stranglehold on cell phone subscribers.

In 2007 Apple an established name in the PC and consumer electronics world decided to enter the cell phone market. To successfully launch a product such as the iPhone you need to get two important stakeholders on board – wireless carriers and end-users; application developers constitute the invisible third front.

Specifically which of the 4P’s and 1C’s: Product, Promotion, Price and Place and Complementors were strategically more important than the others.

When dealing with powerful buyers (end-users or intermediaries) the strategic options that can be successfully employed depends on whether strong buyers / intermediaries :

A) Can be neutralized – In this case, the strategic choices that one can employ are:

    • Product Differentiation
    • Leap Frog
    • Create Switching Costs
    • Co-opt key influencers or decision makers

    B) Cannot be neutralized – In this case the strategic choices that one can employ are:

      • Integrate-Forward (Eliminate Intermediaries)
      • Adopt a “Low-Cost” Model ( Drive out weak competitors, industry consolidation)
      • Go after Niche Markets ( Focus on Segments that are not powerful)

      Strategies to neutralize powerful intermediaries:

      1. Product Differentiation:

      With a Product Differentiation strategy the idea is to offer and position a product that no one else comes close to matching on all product attributes. In the process you ensure low price elasticity.

      Apple developed a product that is far superior and ahead of competition on all fronts and then complemented the same by providing an ecosystem (applications) around it. In doing so Apple neutralized the power of wireless carriers to negotiate better terms or to even refuse carrying the product.

      2. Leap Frog over intermediaries:

      Apple had built a strong brand awareness and reputation with its iPod product line. By leveraging its brand name and effective use of ‘Pull-Marketing’- (advertisements) directly targeting consumers-end-users, Apple managed to create strong demand for the iPhone ahead of its launch.

      By going after the end user Apple, to a certain extent, managed to tilt the balance of power during negotiations with wireless carriers in its favor.

      3. Co-opt key Influencers and Decision makers:

      A wireless carrier is more concerned about ARPU (Average Revenue per User) rather than which handset to carry. But handsets are the primary draw to lure in subscribers. Apple positioned the iPhone in the sweet spot for AT&T by signing an exclusive contract and allowing AT&T to set its own terms for end users. Subscribers were forced to carry a pricier data plan with a 2-yr contract.

      Breakdown of Costs & Revenue for Carrier* 2007 2008 2009
      Average Handset Subsidy per User -$200    
      Average Annual Revenue per User $345 $828 $345
      Lifetime Value of a Subscriber $828    

      * Note: Based on a data plan with a monthly fee of $69.00 and a 2 year contract starting July-1st 2007 and terminating on July 1st 2009.

      Even with $200 subsidy for each iPhone sold, the carrier (AT&T) stands to make money over the 2-yrs lifetime of the customer (see table above). It is a “Win-Win” situation for both Apple and the carrier.

      4. Switching Costs – The use of Complementors:

      Apple launched the iPhone Applications platform allowing handset users to customize and harness the full potential of their handsets using third party applications. Here again Apple allowed application developers full control on what apps to develop, how to price them and whom to target.

      In the process Apple managed to create switching costs for both carriers and end-users.

      Appendix: Why did Apple choose AT&T as an exclusive carrier over others ?

      An exclusive contract with AT&T allows Apple to sell the handset at a higher price and register higher revenues even at the expense of losing some market from the other carriers. The strategy makes sense when you have a superior product, weak competition and skimming prices.

      iphoneLuanch

      Assumptions:

        1. With an exclusive contract, Apple can capture 5% of the subscriber base at AT&T and sell the handset at $299 (8GB) to the carriers.
        2. With an non-exclusive contract Apple can capture 2% of the subscriber base at each of the carriers (AT&T, Verizon, Sprint) and 1% with T-Mobile. Handsets will be sold to each of the carriers at $149

            References:

              • FierceWireless – The wireless industry daily monitor
              • SEC Filings for AT&T, Verizon, Sprint